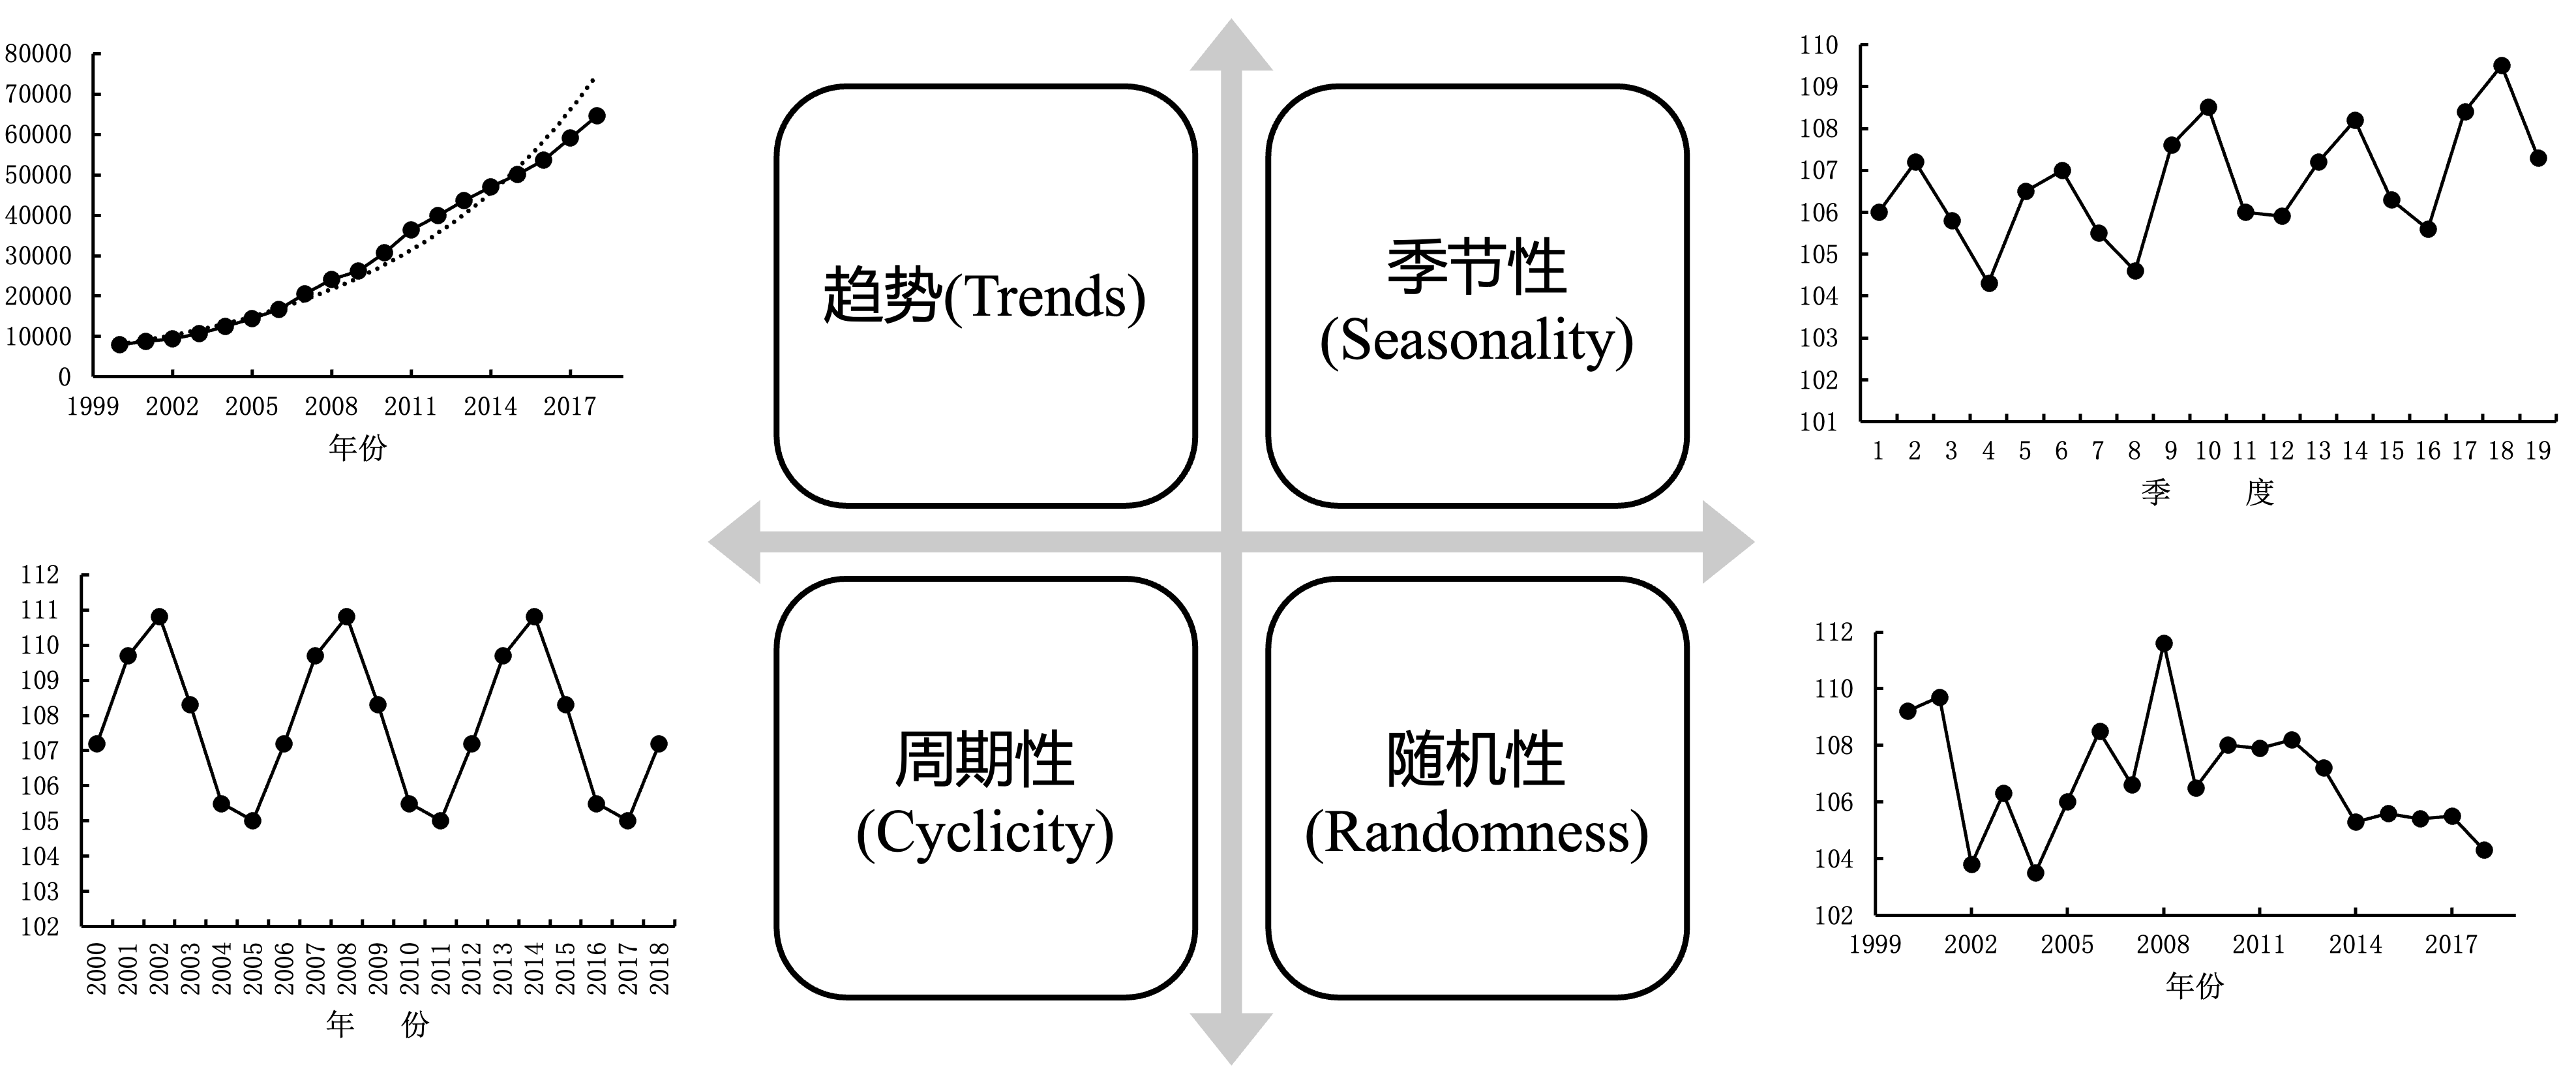
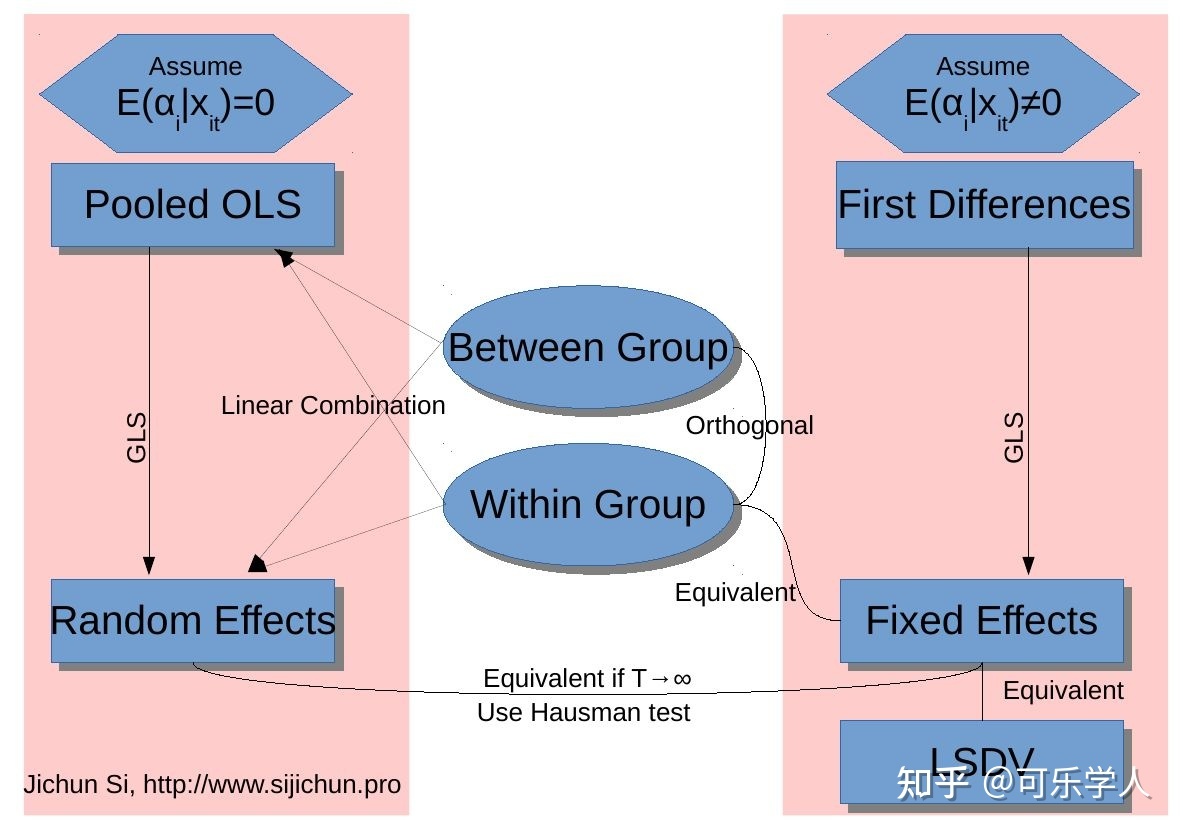
class: center, middle, inverse, title-slide .title[ # 财务管理理论与实务 ] .subtitle[ ## Time series ] .author[ ### 唐润宇 ] .date[ ### 2023-10-26 ] --- # 时间序列 - 时间序列(time series):是按照一定的时间区间进行索引的随机变量序列。 <!-- --> --- ## 时间序列的构成因素  --- ## 时间序列的分解模型 时间序列分析需要把**趋势(T)、季节变动(S)、周期波动(C)和随机波动(R)**这几种成分从时间序列中有目的的分离出来,或者所对数据进行分解、整理,并将它们的关系用一定的数学关系式进行表达,然后分别进行分析,即建立时间序列的分解模型。 按照四种成分对时间序列影响方式的不同,时间序列可分解为多种模型,比如加法模型,乘法模型等,其中比较常用的是乘法模型。 .pull-left[ 乘法模型: `$$Y_t = T_t \times S_t \times C_t \times R_t$$` ] .pull-right[ 加法模型: `$$Y_t = T_t + S_t + C_t + R_t$$` ] --- ## 平稳时间序列的预测 **平稳序列(stationary series)**指的是不含趋势、季节变动和循环波动的序列,即其通常只包含随机成分。 平稳序列的数学定义(宽平稳): `\(x_1, x_2, \ldots, x_T\)` - `\(E[X_t^2]<\infty, \forall t \in T\)`, - `\(E[X_t] = \mu, \forall t \in T\)` 其中 `\(\mu\)`为常数 - `\(\gamma(t, s) = \gamma(k, k+s-t)\)`, `\(\forall t,s,k, k+s-t \in T\)`. 其中 `\(\gamma(t,s) = E[(X_t-\mu_t)(X_s - \mu_s)]\)` 被称为自协方差. **白噪声序列**: 纯随机序列 `\(x_t \sim WN(0, \sigma^2)\)` - `\(E[X_t] = \mu, \forall t \in T\)` 其中 `\(\mu\)`为常数 - `\(\gamma(t, s) = 0\)`, if `\(\forall t\neq s \in T\)` and `\(\gamma(t, s) = \sigma^2\)`, if `\(\forall t=s \in T\)`. ??? 白噪声序列一定是平稳序列,但是一般认为这种序列没有预测的必要。 --- ## 平稳时间序列的预测 **常见方法:** - 移动平均法(Moving Average): `$$F_{t+1} = \frac{Y_{t-d+1} + Y_{t-d+2} + \ldots + Y_t}{d}$$` - 加权移动平均法 $$ F_{t+1} = \omega_1 Y_1 + \omega_2 Y_2 + \ldots + \omega_t Y_t $$ 其中 `\(\sum_t \omega_t = 1\)`. - 指数平滑法: $$ F_{t+1} = \alpha Y_t + (1-\alpha) F_t$$ --- ## 移动平均法 R中常见的处理时间序列的包: zoo, xts ```r setwd("~/XJTU/课程/财务管理理论与实务/Codes") library(tidyverse) library(zoo) data <- read.csv("../Data/002594.SZ.csv") new_dat <- data |> mutate(Date=as.Date(Date, "%Y-%m-%d")) |> select(Date, Adj.Close) ts <- read.zoo(new_dat) ``` --- ##移动平均法 ```r ma5 <- rollmean(ts, 5, align = "right") new <- merge(ma5, ts) autoplot(new, facets=NULL) ``` ``` ## Warning: Removed 4 rows containing missing values (`geom_line()`). ``` <!-- --> --- ##移动平均法 ```r ma50 <- rollmean(ts, 50, align = "right") new <- merge(ma50, new) autoplot(new, facets=NULL) ``` ``` ## Warning: Removed 53 rows containing missing values (`geom_line()`). ``` <!-- --> --- ## 指数平滑法 ```r library(fpp2) ses2 <- ses(new_dat$Adj.Close, alpha = 0.2) autoplot(ses2) ``` <!-- --> --- ## 评价预测方法 - 均方误差 Mean Squared Error(MSE) $$ \frac{\sum_{t=1}^n (Y_t - F_t)^2}{n}$$ > or RMSE = `\(\sqrt{\text{MSE}}\)` - 平均绝对误差 Mean Absolute Error(MAE) $$ \frac{\sum_{t=1}^n |Y_t - F_t|}{n}$$ > or MAPE: `$$\frac{\sum_{t=1}^n |(Y_t - F_t)/Y_t|}{n}$$` --- ## 评价预测方法 使用RSME标准找到合适的 `\(\alpha\)` ```r # identify optimal alpha parameter alpha <- seq(.01, .99, by = .01) RMSE <- NA for(i in seq_along(alpha)) { fit <- ses(new_dat$Adj.Close, alpha = alpha[i], h = 100) RMSE[i] <- accuracy(fit$fitted, new_dat$Adj.Close)[2] } # convert to a data frame and idenitify min alpha value alpha.fit <- tibble(alpha, RMSE) alpha.min <- filter(alpha.fit, RMSE == min(RMSE)) ``` --- 使用RSME标准找到合适的 `\(\alpha\)` ```r # plot RMSE vs. alpha ggplot(alpha.fit, aes(alpha, RMSE)) + geom_line() + geom_point(data = alpha.min, aes(alpha, RMSE), size = 2, color = "blue") ``` <!-- --> --- ## 平稳序列的判断 - 白噪声检验 Box-Pierce or Ljung-Box检验:原假设是延迟阶数小于等于m期的序列值之间没有相关性 ```r Box.test(new_dat$Adj.Close, type="Box-Pierce") ``` ``` ## ## Box-Pierce test ## ## data: new_dat$Adj.Close ## X-squared = 210.18, df = 1, p-value < 2.2e-16 ``` ```r Box.test(new_dat$Adj.Close, type="Ljung-Box") ``` ``` ## ## Box-Ljung test ## ## data: new_dat$Adj.Close ## X-squared = 212.79, df = 1, p-value < 2.2e-16 ``` ??? 推荐LB检验,因为BP不适合小样本场合 (30以内) --- ## ARMA Linear combination of white noise `\(\epsilon\sim N(0, \sigma^2)\)` - MA(q) `$$x_t = \epsilon_t + \theta_1 \epsilon_{t-1} + \ldots + \theta_q \epsilon_{t-q}$$` - AR(p) `$$x_t = \phi_1 x_{t-1} + \phi_2 x_{t-2} + \ldots + \phi_p x_{t-p} + \epsilon_t$$` - ARMA(p, q) `$$x_t = \phi_1 x_{t-1} + \ldots + \phi_p x_{t-p} + \epsilon_t + \theta_1 \epsilon_{t-1} + \ldots + \theta_q \epsilon_{t-q}$$` --- ## ARMA模型的确定 - autocorrelation function (ACF) ```r acf(new_dat$Adj.Close, main="ACF of BYD") ``` <!-- --> ??? ACF explains how the present value of a given time series is correlated with the past (1-unit past, 2-unit past, …, n-unit past) values. In the ACF plot, the y-axis expresses the correlation coefficient whereas the x-axis mentions the number of lags. Assume that, y(t-1), y(t), y(t-1),….y(t-n) are values of a time series at time t, t-1,…,t-n, then the lag-1 value is the correlation coefficient between y(t) and y(t-1), lag-2 is the correlation coefficient between y(t) and y(t-2) and so on. --- ## ARMA模型的确定 - partial autocorrelation function (PACF) ```r pacf(new_dat$Adj.Close, main="PACF of BYD") ``` <!-- --> ??? PACF就是控制了Lag=1…k-1的那部分影响 --- ## ARMA模型的确定 |模型 |ACF|PACF| |------|------|------| |AR(P) | 拖尾 |P阶截尾| |MA(q) |q阶截尾|拖尾| |ARMA(p,q) |拖尾 |拖尾| 所以对于比亚迪的数据我们应该选择AR(1)模型~ **注意:** ARMA模型只适用于平稳序列! **注意:** 画图只是一种辅助手段,我们也可以使用AIC/BIC准则辅助判断 --- ## 平稳序列的检测 - Dickey-Fuller Test: 原假设是该序列不平稳(有趋势性) ```r library(tseries) adf.test(new_dat$Adj.Close) ``` ``` ## ## Augmented Dickey-Fuller Test ## ## data: new_dat$Adj.Close ## Dickey-Fuller = -2.9462, Lag order = 6, p-value = 0.1778 ## alternative hypothesis: stationary ``` - KPSS TEST: 原假设是该序列trend stationary ```r kpss.test(new_dat$Adj.Close, null="Trend") ``` ``` ## ## KPSS Test for Trend Stationarity ## ## data: new_dat$Adj.Close ## KPSS Trend = 0.18388, Truncation lag parameter = 4, p-value = 0.02205 ``` --- ## ARIMA(p, d, q) 相比于ARMA,多考虑了d阶差分。 通过d阶差分后一般可以将非平稳序列转化为平稳序列。 ```r library(forecast) byd.arima <- auto.arima(new_dat$Adj.Close) byd.arima ``` ``` ## Series: new_dat$Adj.Close ## ARIMA(4,1,1) ## ## Coefficients: ## ar1 ar2 ar3 ar4 ma1 ## 1.0179 -0.1395 0.0868 -0.0368 -0.9887 ## s.e. 0.0657 0.0922 0.0941 0.0666 0.0187 ## ## sigma^2 = 22.15: log likelihood = -716.1 ## AIC=1444.21 AICc=1444.57 BIC=1465.14 ``` --- ## ARIMA(p, d, q) ```r checkresiduals(byd.arima) ``` <!-- --> ``` ## ## Ljung-Box test ## ## data: Residuals from ARIMA(4,1,1) ## Q* = 3.2524, df = 5, p-value = 0.6611 ## ## Model df: 5. Total lags used: 10 ``` --- ## ARIMA 预测 ```r byd.fc <- forecast(byd.arima) autoplot(byd.fc) ``` <!-- --> --- ## 时间序列数据的处理 <!--[](Figs/seasonal-adjustment.png)--> ```r library(Ecdat) data(AirPassengers) ts_air = ts(AirPassengers, frequency = 12, start = 1949) decompose_air = decompose(ts_air, "multiplicative") # plotable adjust_air = ts_air / decompose_air$seasonal # decompose_air = decompose(ts_air, "additive") # adjust_air = ts_air - decompose_air$seasonal plot(ts_air, col="grey") lines(adjust_air, col = "blue", lwd = 2) ``` <!-- --> --- ## 时间序列数据的预测 Holt-Winters 方法 ```r forecast = HoltWinters(ts_air) plot(forecast) ``` <!-- --> --- ## 时间序列数据的预测 也可以使用机器学习的方法进行预测~  --- # 面板数据 (Panel data) 经济数据有截面数据(cross sectional data)、时序数据(time series data)和面板数据(panel data)三种类型。截面数据是A和B比,时序数据是以前的A和现在的A比,这两种数据都是一维的。而面板数据是二维数据,既有截面维度(n个个体),也有时间维度(T个时期)https://zhuanlan.zhihu.com/p/356250433  --- ## 面板回归模型设定 - 截面数据的线性回归 $$ y_i = \mathbf{x_i' \beta} + \epsilon_i$$ - 加入时间维度的**个体效应模型** `$$y_{it} = \mathbf{x_{it}' \beta} + u_i + \epsilon_{it}$$` 其中 `\(u_i\)`为不随时间变化但是随个体变化的因素 常见的三种估计策略 > 混合效应模型(Pooled): 忽略个体效应 > 固定效应模型(Fixed-effect):假设异质性截距是非随机的, `\(u_i\)` 与某个解释变量相关 > 随机效应模型(Random-effect): 假设异质性截距是随机的, `\(u_i\)` 与所有解释变量都不相关 --- ## 面板回归 in R 混合效应 .scroll-output[ ```r data <- read.csv("../Data/FS_Comins_small.csv") pool_lm <- lm(OpeRev~RDCost, data=data) summary(pool_lm) ``` ``` ## ## Call: ## lm(formula = OpeRev ~ RDCost, data = data) ## ## Residuals: ## Min 1Q Median 3Q Max ## -9.724e+11 -1.412e+09 -1.825e+08 3.365e+08 2.671e+12 ## ## Coefficients: ## Estimate Std. Error t value Pr(>|t|) ## (Intercept) -3.596e+08 8.558e+07 -4.202 2.65e-05 *** ## RDCost 5.072e+01 1.301e-01 389.964 < 2e-16 *** ## --- ## Signif. codes: 0 '***' 0.001 '**' 0.01 '*' 0.05 '.' 0.1 ' ' 1 ## ## Residual standard error: 3.439e+10 on 167247 degrees of freedom ## Multiple R-squared: 0.4762, Adjusted R-squared: 0.4762 ## F-statistic: 1.521e+05 on 1 and 167247 DF, p-value: < 2.2e-16 ``` ] --- ## 面板回归 in R 固定效应 .scroll-output[ ```r library(plm) data |> select(-X) |> group_by(Name, Date) |> filter(row_number() == 1) -> new_data fe_lm <- plm(OpeRev~RDCost, data=new_data, index=c("Name", "Date"), model="within") summary(fe_lm) ``` ``` ## Oneway (individual) effect Within Model ## ## Call: ## plm(formula = OpeRev ~ RDCost, data = new_data, model = "within", ## index = c("Name", "Date")) ## ## Unbalanced Panel: n = 5954, T = 1-26, N = 99887 ## ## Residuals: ## Min. 1st Qu. Median Mean 3rd Qu. Max. ## -7.26e+11 -3.76e+08 3.56e+07 0.00e+00 4.60e+08 1.94e+12 ## ## Coefficients: ## Estimate Std. Error t-value Pr(>|t|) ## RDCost 38.84013 0.13938 278.67 < 2.2e-16 *** ## --- ## Signif. codes: 0 '***' 0.001 '**' 0.01 '*' 0.05 '.' 0.1 ' ' 1 ## ## Total Sum of Squares: 6.5036e+25 ## Residual Sum of Squares: 3.5602e+25 ## R-Squared: 0.45257 ## Adj. R-Squared: 0.41788 ## F-statistic: 77656.8 on 1 and 93932 DF, p-value: < 2.22e-16 ``` ] --- ## 面板回归 in R 随机效应 .scroll-output[ ```r re_lm <- plm(OpeRev~RDCost, data=new_data, index=c("Name", "Date"), model="random", random.method = "ht") summary(re_lm) ``` ``` ## Oneway (individual) effect Random Effect Model ## (Hausman-Taylor's transformation) ## ## Call: ## plm(formula = OpeRev ~ RDCost, data = new_data, model = "random", ## random.method = "ht", index = c("Name", "Date")) ## ## Unbalanced Panel: n = 5954, T = 1-26, N = 99887 ## ## Effects: ## var std.dev share ## idiosyncratic 3.790e+20 1.947e+10 0.506 ## individual 3.697e+20 1.923e+10 0.494 ## theta: ## Min. 1st Qu. Median Mean 3rd Qu. Max. ## 0.8052 0.8052 0.8052 0.8052 0.8052 0.8052 ## ## Residuals: ## Min. 1st Qu. Median Mean 3rd Qu. Max. ## -6.10e+11 -6.63e+08 -2.38e+08 0.00e+00 1.38e+08 2.10e+12 ## ## Coefficients: ## Estimate Std. Error z-value Pr(>|z|) ## (Intercept) 1.2171e+09 3.1666e+08 3.8437 0.0001212 *** ## RDCost 3.9396e+01 1.3664e-01 288.3270 < 2.2e-16 *** ## --- ## Signif. codes: 0 '***' 0.001 '**' 0.01 '*' 0.05 '.' 0.1 ' ' 1 ## ## Total Sum of Squares: 6.9356e+25 ## Residual Sum of Squares: 3.7852e+25 ## R-Squared: 0.45423 ## Adj. R-Squared: 0.45423 ## Chisq: 83132.5 on 1 DF, p-value: < 2.22e-16 ``` ] --- ## RE or FE **When to use which?** 固定效应允许 `\(u_i\)` 和 `\(x\)` 任意相关,而随机效应不然, 通常认为在其他条件不变时 FE 是更令人信服的工具。 如果使用随机效应,在解释变量中包含的非时变控制变量应尽量多(FE则不必如此)。 常见的情况是,研究者应同时使用随机效应和固定效应,然后规范地检验解释变量系数的统计显著性差别。 .pull-right[ --- 伍德里奇《计量经济学导论》 ] --- ## PLM 