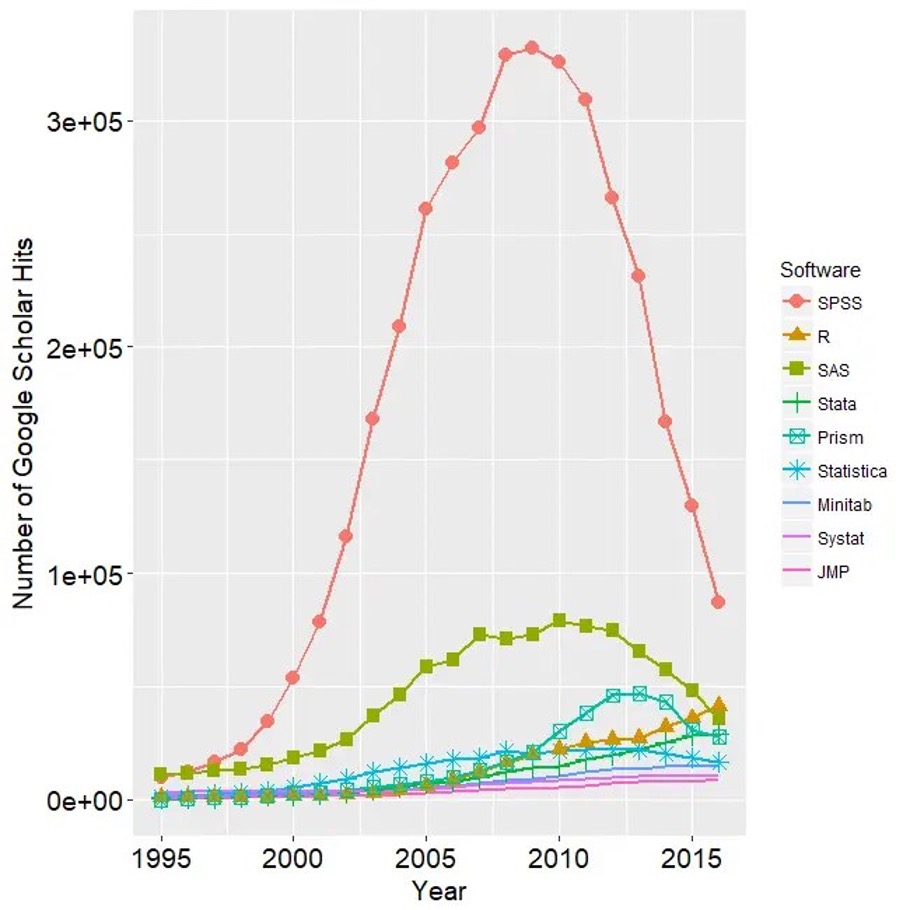
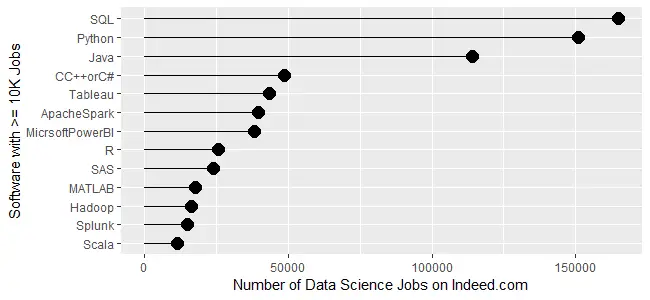
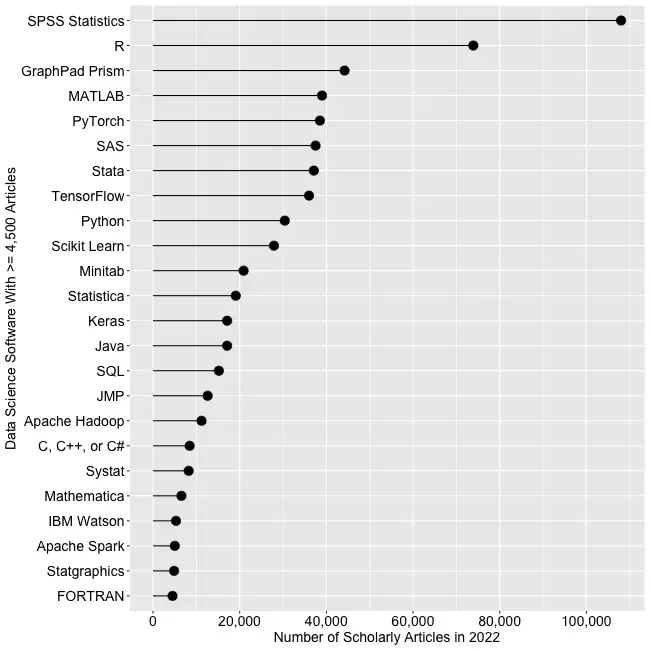
class: center, middle, inverse, title-slide .title[ # 财务管理理论与实务 ] .subtitle[ ## Intro to R ] .author[ ### 唐润宇 ] .date[ ### 2023-10-07 ] --- # What is R ## 常见统计软件 >- SPSS: IBM旗下产品, 99usd/month >- STATA: 325usd/year (mid-size dataset), 625usd/year (large dataset) >- EXCEL: 可以简单使用,但是并不专业。 >- python: 更通用的编程语言, 并非针对统计和数据分析所设计, 不过有很多机器学习相关的包。 >- Julia: 为了数值计算的新语言,速度快,容易写,但也并非专为数据分析设计 >- SAS, Eviews, Matlab,... >- **R: 开源且免费!** --- ## 什么是开源软件? - Open source software - 是源代码可以任意获取的计算机软件,这种软件的著作权持有人在软件协议的规定下保留一部分权利并允许用户学习、修改以及以任何目的向任何人分发该软件。 - 开源 **不等于** 免费! 常见的开源: >- Android >- Linux >- Firefox >- 特斯拉的部分技术 >- ChatGPT背后的公司"open"AI 推荐阅读:《大教堂与集市》 by Eric S. Raymond ??? 只有当程序员非常积极以至于没有奖励他(她)也愿意工作时,才是唯一给予绩效奖励的时候。 --- ## R有活跃的开源社区 When you download and install R, you get a collection of **basic packages** (or “libraries”) that can be used to implement several common data manipulations, graphical displays, and statistical models. 当我们下载安装R后,我们得到了一些基础包,可以做一些简单的数据处理、可视化、统计等操作。 The real power of R comes in the form of the Comprehensive R Archive Network **(CRAN)**, which is a repository where individuals can upload their own R packages for others to use. 但是R真正的力量在我们使用CRAN内各种各样的第三方包后才得以显现,每个人都可以上传自己制作的R包供世界各地的人使用。 --- ## Rstudio RStudio is an “integrative development environment” (IDE) for R that is freely available for desktops and servers running R. The RStudio IDE has the benefit of allowing you to... >- develop R code (in the Editor) >- run R code (in the Console) >- see the objects in your R environment (in the Workspace) >- review past R code that you've run (in the History) >- view various other information (e.g., related to File paths, created Plots, installed Packages, and Help files) 有开源、免费版本可用 url: https://posit.co/products/open-source/rstudio/ --- # Why do we choose R ## R的优点 .pull-left[  ] .pull-right[ >- 开源软件 >- 免费使用 >- 多平台兼容(linux, windows, macos) >- 功能强大,自由度高 >- 丰富的社区与文档 [The popularity of Data science software](https://r4stats.com/articles/popularity/) ] --- ## R 在业界  | Software | Jobs only for “Statistician” | | ----------- | ----------- | | R |1040| |SAS |1012| |Stata |176| |SPSS |146| |JMP |93| |Minitab |55| [R in job market](https://r4stats.com/articles/popularity/) --- ## R 在学界  --- ## 从哪里学习R呢? - **An Introduction to R** Complete introduction to base R. url: <https://cran.r-project.org/doc/manuals/r-release/R-intro.pdf> - **R for Data Science** Introduction to data analysis using R, focused on the tidyverse packages. If your goal is to find a substitute for Stata, start here. url: <http://r4ds.had.co.nz/> 如果你喜欢看中文版的,这里有个类似的: <https://bookdown.org/wangminjie/R4DS/> - **R for Data Analytics** More related to Financial Modelling and Analytics. url: <https://rforanalytics.com/> --- ## Tidyverse Tidyverse 出自于R大神Hadley Wickham <https://hadley.nz/>之手,他是Rstudio首席科学家。tidyverse就是他将自己所写的包整理成了一整套**优雅的**数据处理的方法。  ```r # 安装tidyverse install.packages("tidyverse") # 使用前需要载入 library(tidyverse) ``` --- # Basics in R R can be used as a simple calculator and we can perform any simple computation. ```r 2 ``` ``` ## [1] 2 ``` ```r 2+3 ``` ``` ## [1] 5 ``` ```r log(2) ``` ``` ## [1] 0.6931472 ``` --- ## Numeric and string objects 数值/字符型变量 ```r x = 2 x ``` ``` ## [1] 2 ``` ```r x= 'Hello' x ``` ``` ## [1] "Hello" ``` --- ## Vectors 向量 ```r Height = c(168, 177, 177, 177, 178, 172, 165, 171, 178, 170) Height[2] # Print the second component ``` ``` ## [1] 177 ``` ```r # Print the second, the 3rd, the 4th and 5th component Height[2:5] ``` ``` ## [1] 177 177 177 178 ``` ```r (obs = 1:10) # ``` ``` ## [1] 1 2 3 4 5 6 7 8 9 10 ``` --- ## Vectors 向量 我们可以直接对向量进行操作 ```r Weight = c(88, 72, 85, 52, 71, 69, 61, 61, 51, 75) # Performs a simple calculation using vectors BMI = Weight/((Height/100)^2) BMI ``` ``` ## [1] 31.17914 22.98190 27.13141 16.59804 22.40879 23.32342 22.40588 20.86112 ## [9] 16.09645 25.95156 ``` --- ## Vectors 向量 也可以计算常见统计量 ```r length(Height) ``` ``` ## [1] 10 ``` ```r mean(Height) ``` ``` ## [1] 173.3 ``` ```r var(Height) ``` ``` ## [1] 22.23333 ``` --- ## Matrices 矩阵 ```r M = cbind(Height,Weight,BMI) # Create a matrix typeof(M) # Give the type of the matrix ``` ``` ## [1] "double" ``` ```r class(M) # Give the class of an object ``` ``` ## [1] "matrix" "array" ``` ```r is.matrix(M) # Check if M is a matrix ``` ``` ## [1] TRUE ``` ```r dim(M) # Dimensions of a matrix ``` ``` ## [1] 10 3 ``` --- ## Simple plotting - 如果我们需要“quick and dirty”的图, 可以使用plot. - 如果我们需要更加好看高阶的图画,那么请使用ggplot. ```r plot(Height,Weight,ylab="Weight",xlab="Height") ``` <!-- --> --- ## Dataframe (tibble) - **tibbles** are modernized versions of **dataframes**. - Technically: Lists of vectors (with names). - Can have different datatypes in different vectors ```r library(tibble) # Load the tidyverse tibble package mydat = as_tibble(M) # Creates a tibble names(mydat) # Give the names of each variable ``` ``` ## [1] "Height" "Weight" "BMI" ``` ```r summary(mydat) # Descriptive Statistics ``` ``` ## Height Weight BMI ## Min. :165.0 Min. :51.00 Min. :16.10 ## 1st Qu.:170.2 1st Qu.:61.00 1st Qu.:21.25 ## Median :174.5 Median :70.00 Median :22.70 ## Mean :173.3 Mean :68.50 Mean :22.89 ## 3rd Qu.:177.0 3rd Qu.:74.25 3rd Qu.:25.29 ## Max. :178.0 Max. :88.00 Max. :31.18 ``` --- ## Reading and writing data 读写数据 - 读写数据有很多方式 - 我们可以使用tidyverse里面的readr包 ```r library(readr) #load the tidyverse readr package write_csv(mydat, "my_data.csv") mydat2=read_csv("my_data.csv") mydat2 ``` ``` ## # A tibble: 10 × 3 ## Height Weight BMI ## <dbl> <dbl> <dbl> ## 1 168 88 31.2 ## 2 177 72 23.0 ## 3 177 85 27.1 ## 4 177 52 16.6 ## 5 178 71 22.4 ## 6 172 69 23.3 ## 7 165 61 22.4 ## 8 171 61 20.9 ## 9 178 51 16.1 ## 10 170 75 26.0 ``` --- ## Working directory 工作路径 我们可以查看和设置工作路径。 Note for Windows users : R uses slash ("/") in the directory instead of backslash ("\\") ```r setwd("~/Desktop") # Sets working directory getwd() # Returns current working directory dir() # Lists the content of the working director ``` 我们可以使用?来查看帮助文档 ```r ?dir ``` --- # 数据的整理 ## Data transformation 很多时候我们需要把原始数据表格进行整理,比如创建新的变量,筛选数据,更改变量名等等。 我们可以使用**dplyr**包实现这个操作。 我们使用从CSMAR数据库<https://data.csmar.com/>中下载的近五年上市公司利润表数据作为演示(FS_Comins.xlsx)。 首先读取数据 ```r library(tidyverse) library(readxl) setwd("~/XJTU/课程/财务管理理论与实务/Codes") data = read_xlsx("../Data/FS_Comins.xlsx") # str(data) ``` --- ## 变量重命名 我们发现变量名大多是一些英文字符缩写,很难理解 我们可以跳过第一行读取数据 ```r data = read_xlsx("../Data/FS_Comins.xlsx", skip=1) ``` 也可以将数据重命名 ```r names(data) = data[1,] ``` ``` ## Warning: The `value` argument of `names<-` must be a character vector as of tibble ## 3.0.0. ## This warning is displayed once every 8 hours. ## Call `lifecycle::last_lifecycle_warnings()` to see where this warning was ## generated. ``` 当然我们也可以只修改其中某一列变量名 ```r rename(data, 简称 = 证券简称) # =左边是新名字,右边是旧名字 ``` --- ## 常用行操作 - filter(): 筛选 - arrange(): 排序 - distinct(): 去重 ```r new_data <- data |> filter(证券代码 == "002594" & 报表类型== "A") str(new_data) ``` ``` ## tibble [27 × 77] (S3: tbl_df/tbl/data.frame) ## $ 证券代码 : chr [1:27] "002594" "002594" "002594" "002594" ... ## $ 证券简称 : chr [1:27] "比亚迪" "比亚迪" "比亚迪" "比亚迪" ... ## $ 统计截止日期 : chr [1:27] "2018-01-01" "2018-03-31" "2018-06-30" "2018-09-30" ... ## $ 报表类型 : chr [1:27] "A" "A" "A" "A" ... ## $ 是否发生差错更正 : chr [1:27] "1.0" "0.0" "0.0" "0.0" ... ## $ 差错更正披露日期 : chr [1:27] "2019-03-28" NA NA NA ... ## $ 营业总收入 : chr [1:27] "1.05914702E11" "2.4737565E10" "5.415093E10" "8.8981326E10" ... ## $ 营业收入 : chr [1:27] "1.05914702E11" "2.4737565E10" "5.415093E10" "8.8981326E10" ... ## $ 利息净收入 : chr [1:27] NA NA NA NA ... ## $ 利息收入 : chr [1:27] NA NA NA NA ... ## $ 利息支出 : chr [1:27] NA NA NA NA ... ## $ 已赚保费 : chr [1:27] NA NA NA NA ... ## $ 保险业务收入 : chr [1:27] NA NA NA NA ... ## $ 其中:分保费收入 : chr [1:27] NA NA NA NA ... ## $ 减:分出保费 : chr [1:27] NA NA NA NA ... ## $ 减:提取未到期责任准备金 : chr [1:27] NA NA NA NA ... ## $ 手续费及佣金净收入 : chr [1:27] NA NA NA NA ... ## $ 其中:代理买卖证券业务净收入 : chr [1:27] NA NA NA NA ... ## $ 其中:证券承销业务净收入 : chr [1:27] NA NA NA NA ... ## $ 其中:受托客户资产管理业务净收入 : chr [1:27] NA NA NA NA ... ## $ 手续费及佣金收入 : chr [1:27] NA NA NA NA ... ## $ 手续费及佣金支出 : chr [1:27] NA NA NA NA ... ## $ 其他业务收入 : chr [1:27] NA NA NA NA ... ## $ 营业总成本 : chr [1:27] "1.01373317E11" "2.4909165E10" "5.4415236E10" "8.8684663E10" ... ## $ 营业成本 : chr [1:27] "8.5775482E10" "2.0496606E10" "4.5527378E10" "7.4365146E10" ... ## $ 退保金 : chr [1:27] NA NA NA NA ... ## $ 赔付支出净额 : chr [1:27] NA NA NA NA ... ## $ 赔付支出 : chr [1:27] NA NA NA NA ... ## $ 减:摊回赔付支出 : chr [1:27] NA NA NA NA ... ## $ 提取保险责任准备金净额 : chr [1:27] NA NA NA NA ... ## $ 提取保险责任准备金 : chr [1:27] NA NA NA NA ... ## $ 减:摊回保险责任准备金 : chr [1:27] NA NA NA NA ... ## $ 保单红利支出 : chr [1:27] NA NA NA NA ... ## $ 分保费用 : chr [1:27] NA NA NA NA ... ## $ 税金及附加 : chr [1:27] "1.329477E9" "4.53674E8" "8.48039E8" "1.471107E9" ... ## $ 业务及管理费 : chr [1:27] NA NA NA NA ... ## $ 减:摊回分保费用 : chr [1:27] NA NA NA NA ... ## $ 保险业务手续费及佣金支出 : chr [1:27] NA NA NA NA ... ## $ 销售费用 : chr [1:27] "4.925288E9" "1.172277E9" "2.623968E9" "4.14444E9" ... ## $ 管理费用 : chr [1:27] "3.046592E9" "1.883398E9" "1.757397E9" "2.679375E9" ... ## $ 研发费用 : chr [1:27] "3.739491E9" NA "2.079169E9" "3.486877E9" ... ## $ 财务费用 : chr [1:27] "2.314401E9" "8.13445E8" "1.361129E9" "2.205928E9" ... ## $ 其中:利息费用(财务费用) : chr [1:27] "2.34277E9" NA "1.455988E9" "2.595277E9" ... ## $ 其中:利息收入(财务费用) : chr [1:27] "9.5783E7" NA "-6.7379E7" "1.25957E8" ... ## $ 其他收益 : chr [1:27] "1.248535E9" "6.30764E8" "8.88152E8" "1.443884E9" ... ## $ 投资收益 : chr [1:27] "-2.06053E8" "-3369000.0" "3.95557E8" "5.42936E8" ... ## $ 其中:对联营企业和合营企业的投资收益 : chr [1:27] "-2.24522E8" "-3369000.0" "-2.6557E7" "8.8424E7" ... ## $ 其中:以摊余成本计量的金融资产终止确认收益 : chr [1:27] NA NA NA NA ... ## $ 汇兑收益 : chr [1:27] NA NA NA NA ... ## $ 净敞口套期收益 : chr [1:27] NA NA NA NA ... ## $ 公允价值变动收益 : chr [1:27] "-1.18166E8" "-1.85943E8" "-1.5981E7" "3.5457E7" ... ## $ 资产减值损失 : chr [1:27] "2.42586E8" "8.9765E7" "1.25113E8" "2.0973E8" ... ## $ 信用减值损失 : chr [1:27] NA NA "9.3043E7" "1.2206E8" ... ## $ 资产处置收益 : chr [1:27] "-5.515E7" "-2.0726E7" "-2.2837E7" "-1.8169E7" ... ## $ 其他业务成本 : chr [1:27] NA NA NA NA ... ## $ 其他业务利润 : chr [1:27] NA NA NA NA ... ## $ 营业利润 : chr [1:27] "5.410551E9" "2.49126E8" "9.80585E8" "2.300771E9" ... ## $ 加:营业外收入 : chr [1:27] "2.7903E8" "7.011E7" "1.37533E8" "1.84239E8" ... ## $ 其中:非流动资产处置利得 : chr [1:27] NA NA NA NA ... ## $ 减:营业外支出 : chr [1:27] "6.894E7" "1.3675E7" "3.1064E7" "5.0855E7" ... ## $ 其中:非流动资产处置净损益 : chr [1:27] NA NA NA NA ... ## $ 其中:非流动资产处置损失 : chr [1:27] NA NA NA NA ... ## $ 利润总额 : chr [1:27] "5.620641E9" "3.05561E8" "1.087054E9" "2.434155E9" ... ## $ 减:所得税费用 : chr [1:27] "7.03705E8" "4.142E7" "2.12693E8" "2.88003E8" ... ## $ 未确认的投资损失 : chr [1:27] NA NA NA NA ... ## $ 影响净利润的其他项目 : chr [1:27] NA NA NA NA ... ## $ 净利润 : chr [1:27] "4.916936E9" "2.64141E8" "8.74361E8" "2.146152E9" ... ## $ 归属于母公司所有者的净利润 : chr [1:27] "4.066478E9" "1.02425E8" "4.79099E8" "1.527053E9" ... ## $ 归属于母公司其他权益工具持有者的净利润 : chr [1:27] NA NA NA NA ... ## $ 少数股东损益 : chr [1:27] "8.50458E8" "1.61716E8" "3.95262E8" "6.19099E8" ... ## $ 基本每股收益 : chr [1:27] "1.4" "0.02" "0.13" "0.49" ... ## $ 稀释每股收益 : chr [1:27] "1.4" "0.02" "0.13" "0.49" ... ## $ 其他综合收益(损失) : chr [1:27] "3.13066E8" "1.1263E7" "-5.18596E8" "-1.263154E9" ... ## $ 综合收益总额 : chr [1:27] "5.230002E9" "2.75404E8" "3.55765E8" "8.82998E8" ... ## $ 归属于母公司所有者的综合收益 : chr [1:27] "4.37691E9" "1.14953E8" "-3.573E7" "2.70009E8" ... ## $ 归属于母公司其他权益工具持有者的综合收益总额: chr [1:27] NA NA NA NA ... ## $ 归属少数股东的综合收益 : chr [1:27] "8.53092E8" "1.60451E8" "3.91495E8" "6.12989E8" ... ``` --- ## 常用列操作 - mutate(): 添加新列 - select(): 选择变量 ```r new_data <- new_data |> select(证券简称,统计截止日期, 营业总收入, 营业收入, 研发费用, 财务费用) str(new_data) ``` ``` ## tibble [27 × 6] (S3: tbl_df/tbl/data.frame) ## $ 证券简称 : chr [1:27] "比亚迪" "比亚迪" "比亚迪" "比亚迪" ... ## $ 统计截止日期: chr [1:27] "2018-01-01" "2018-03-31" "2018-06-30" "2018-09-30" ... ## $ 营业总收入 : chr [1:27] "1.05914702E11" "2.4737565E10" "5.415093E10" "8.8981326E10" ... ## $ 营业收入 : chr [1:27] "1.05914702E11" "2.4737565E10" "5.415093E10" "8.8981326E10" ... ## $ 研发费用 : chr [1:27] "3.739491E9" NA "2.079169E9" "3.486877E9" ... ## $ 财务费用 : chr [1:27] "2.314401E9" "8.13445E8" "1.361129E9" "2.205928E9" ... ``` --- ## The pipe 我们可以按照顺序进行一系列的操作 在每行末尾使用"|>" (或者"%>%")来连接各种操作 ```r new_data <- data |> mutate(日期 = as.Date(统计截止日期, "%Y-%m-%d")) |> filter(日期 > "2012-1-1" & 证券简称 == "比亚迪") |> select(日期, 营业总收入, 营业收入, 研发费用, 财务费用) |> mutate_if(is.character, as.numeric) str(new_data) ``` ``` ## tibble [50 × 5] (S3: tbl_df/tbl/data.frame) ## $ 日期 : Date[1:50], format: "2018-01-01" "2018-01-01" ... ## $ 营业总收入: num [1:50] 1.06e+11 1.42e+10 2.47e+10 1.81e+09 6.39e+09 ... ## $ 营业收入 : num [1:50] 1.06e+11 1.42e+10 2.47e+10 1.81e+09 6.39e+09 ... ## $ 研发费用 : num [1:50] 3.74e+09 6.91e+07 NA NA 3.20e+07 ... ## $ 财务费用 : num [1:50] 2.31e+09 9.65e+08 8.13e+08 2.76e+08 6.32e+08 ... ``` --- ## Data tidying > "Happy families are all alike; every unhappy family is unhappy in its own way." > --- Leo Tolstoy > "Tidy datasets are all alike, but every messy dataset is messy in its own way." > --- Hadley Wickham  There are three interrelated rules that make a dataset tidy: - Each variable is a column; each column is a variable. - Each observation is a row; each row is an observation. - Each value is a cell; each cell is a single value. ??? we can use pivot_longer() and pivot_wider() 来转换我们的数据 比如我们可能会想把A B财务类型 的某个指标放到一行 --- # 数据可视化 > "The simple graph has brought more information to the data analyst’s mind than any other device." > --- John Tukey R里面画图的最强工具包: **ggplot2** (这个也是Hadley Wickham的作品,属于tidy universe的一员) ```r ggplot(data = new_data) ``` <!-- --> --- ## ggplot ```r ggplot( data = new_data, mapping = aes(x = 研发费用, y = 营业收入) ) ``` <!-- --> ```r newer_data <- new_data |> rename(RDCost = 研发费用, OpeRev = 营业收入) |> mutate(FinCost = ifelse(财务费用>0, "positive", "negative")) ``` --- ## ggplot ```r ggplot( data = newer_data, mapping = aes(x = RDCost, y = OpeRev) ) + geom_point() ``` ``` ## Warning: Removed 2 rows containing missing values (`geom_point()`). ``` <!-- --> --- ## ggplot 注意: ggplot中"+"必须在行尾 ```r ggplot( data = newer_data, mapping = aes(x = RDCost, y = OpeRev, color=FinCost) ) + geom_point() ``` <!-- --> --- ## ggplot ```r ggplot( data = newer_data, mapping = aes(x = RDCost, y = OpeRev, color=FinCost) ) + geom_point() + geom_smooth(method="lm") ``` ``` ## `geom_smooth()` using formula = 'y ~ x' ``` <!-- --> --- ## ggplot ```r ggplot( data = newer_data, mapping = aes(x = RDCost, y = OpeRev) ) + geom_point(mapping = aes(color=FinCost)) + geom_smooth(method="lm") ``` ``` ## `geom_smooth()` using formula = 'y ~ x' ``` <!-- --> --- ## ggplot ```r ggplot( data = newer_data, mapping = aes(x = RDCost, y = OpeRev) ) + geom_point(mapping = aes(color=FinCost, shape=FinCost)) + geom_smooth(method="lm") ``` ``` ## `geom_smooth()` using formula = 'y ~ x' ``` <!-- --> --- ## ggplot ```r ggplot(data = newer_data, mapping = aes(x = RDCost, y = OpeRev)) + geom_point(mapping = aes(color=FinCost, shape=FinCost)) + geom_smooth(method="lm") + labs( title = "BYD financial condition", x="R&D", y="Revenue", color="Financial cost", shape="Financial cost" ) ``` ``` ## `geom_smooth()` using formula = 'y ~ x' ``` <!-- --> --- ## 单个类别型变量 ```r ggplot(data = newer_data, mapping = aes(x = FinCost )) + geom_bar() ``` <!-- --> --- ## 上课时间统计 ```r dat <- read_xlsx("../Data/上课时间统计.xlsx") dat |> mutate(Time = ifelse(`1、上课时间` == 1, "Tuesday", "Thursday")) |> ggplot(aes(x=Time))+ geom_bar() ``` <!-- --> --- ## 单个数值型变量 直方图:我们可以手动修改bins, binwidth ```r ggplot( data = newer_data, mapping = aes(x = OpeRev) ) + geom_histogram() ``` ``` ## `stat_bin()` using `bins = 30`. Pick better value with `binwidth`. ``` <!-- --> --- ## 单个数值型变量 有时候我们会使用density plot 去代替直方图 ```r ggplot( data = newer_data, mapping = aes(x = OpeRev) ) + geom_density() ``` <!-- --> --- ## 数值型变量与类别型变量 箱线图 ```r ggplot(data = newer_data, mapping = aes(x=FinCost, y=OpeRev) ) + geom_boxplot() ``` <!-- --> --- ## 数值型变量与类别型变量 当然我们也可以使用density plot ```r ggplot(data = newer_data, aes(x=OpeRev, color=FinCost, fill=FinCost) ) + geom_density(alpha=0.5) ``` <!-- --> --- ## 两个类别变量 首先我们先重新整理一套数据 ```r new_data <- data |> mutate(日期 = as.Date(统计截止日期, "%Y-%m-%d")) |> filter(日期 > "2012-1-1" & 证券简称 == "比亚迪" | 证券简称 == "长安汽车") |> select(证券代码, 日期, 营业总收入, 营业收入, 研发费用, 财务费用) |> type_convert() |> rename(RDCost = 研发费用, OpeRev = 营业收入, Name=证券代码) |> mutate(FinCost = ifelse(财务费用>0, "positive", "negative")) ``` ``` ## ## ── Column specification ──────────────────────────────────────────────────────── ## cols( ## 证券代码 = col_character(), ## 营业总收入 = col_double(), ## 营业收入 = col_double(), ## 研发费用 = col_double(), ## 财务费用 = col_double() ## ) ``` --- ## 两个类别变量 ```r ggplot(data = new_data, aes(x=FinCost, fill= Name) ) + geom_bar() ``` <!-- --> --- ## 两个类别变量 ```r ggplot(data = new_data, aes(x=FinCost, fill= Name) ) + geom_bar(position="fill") ``` <!-- --> --- ## 多个变量 可以通过颜色,形状来区分多个变量 ```r ggplot(new_data, aes(x=RDCost, y=OpeRev)) + geom_point(aes(color=Name, shape=FinCost)) ``` ``` ## Warning: Removed 6 rows containing missing values (`geom_point()`). ``` <!-- --> --- ## 多个变量 当我们的变量过多的时候,图形看起来很混乱,所以有时候我们可以使用facet_wrap()给图分成几部分。 ```r ggplot(new_data, aes(x=RDCost, y=OpeRev)) + geom_point(aes(color=FinCost, shape=FinCost)) + facet_wrap(~Name) ``` <!-- --> --- # R Markdown 今天的课件是使用 R Markdown 制作的. **Markdown** is a simple formatting syntax for authoring HTML, PDF, and MS Word documents. For more details on using R Markdown see <http://rmarkdown.rstudio.com>. R Markdown 能做什么? - 制作数据分析报告 - 制作演示文稿: <https://bookdown.org/yihui/rmarkdown/> - 制作个人主页: <https://bookdown.org/yihui/blogdown/> - ...